El Nino 2026-27 and East Europe
Author: Laurence Hewick, PhD.
Date: 06/26
El Niño and La Niña are natural occurring opposing warm and cool phases of a natural climate cycle that change the circulation of air in the atmosphere and are known as the El Niño-Southern Oscillation (ENSO). They occur across the tropical Pacific Ocean and significantly disrupt global weather patterns, temperatures, and marine ecosystems. They typically last from late summer to the next summer but “super El Ninos” can last two years.
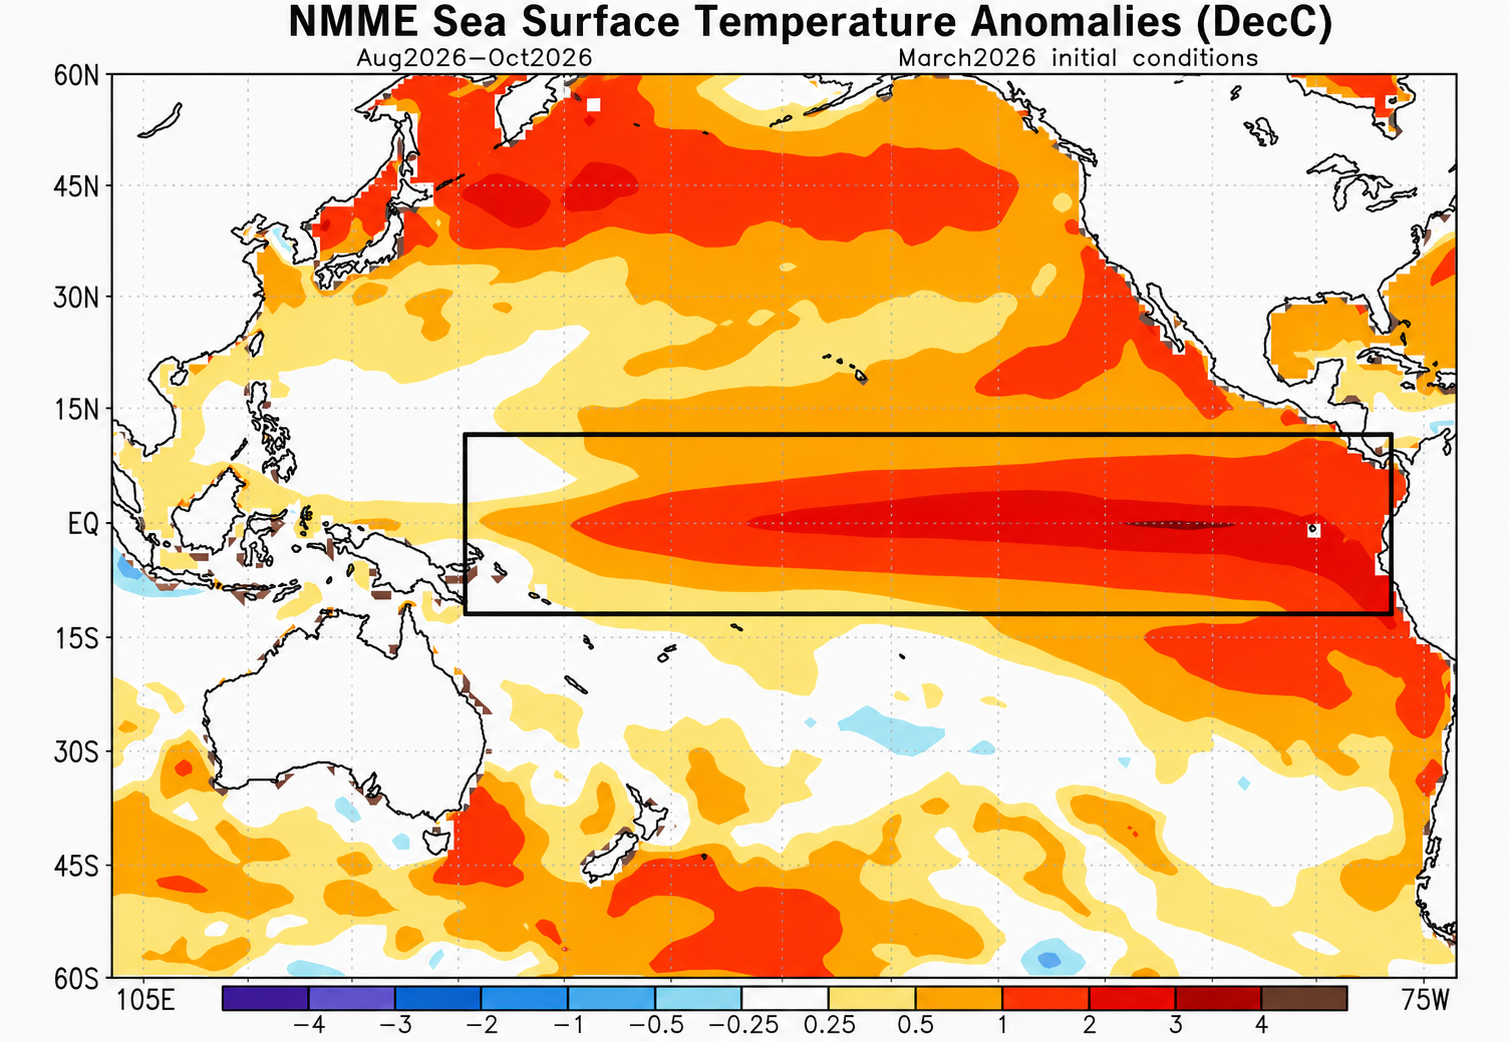
But the effects of El Niño do not stay limited to that part of the Pacific. They ricochet outward to affect weather and climate patterns around the globe. In 2026-2027 there is a high probability that a “Super” El Niño is poised to affect the lives of hundreds of millions of people worldwide as it strengthens through the year into the winter season. It may also alter ecosystems for decades to come, judging from the repercussions of past intense El Niños.
The last Super El Niño reshaped weather and economies around the world, leaving disruptions that lingered long after the Pacific cooled. Now, as another powerful El Niño builds, we’re looking for clues about what hundreds of millions of people and the planet’s most fragile ecosystems may face next. Past Super El Niños are an imperfect guide to this upcoming one, since no two El Niños are alike in their impact. Some computer models show the upcoming El Niño exceeding the intensity of all those events to become the most intense since at least 1950. It’s not the most likely scenario, but that’s the biggest point of uncertainty in its impacts. We aren’t going to know its peak strength until it happens. In Europe the main area affected is shown below, with orange areas hit the strongest with increases in heat of about 2.0°C.
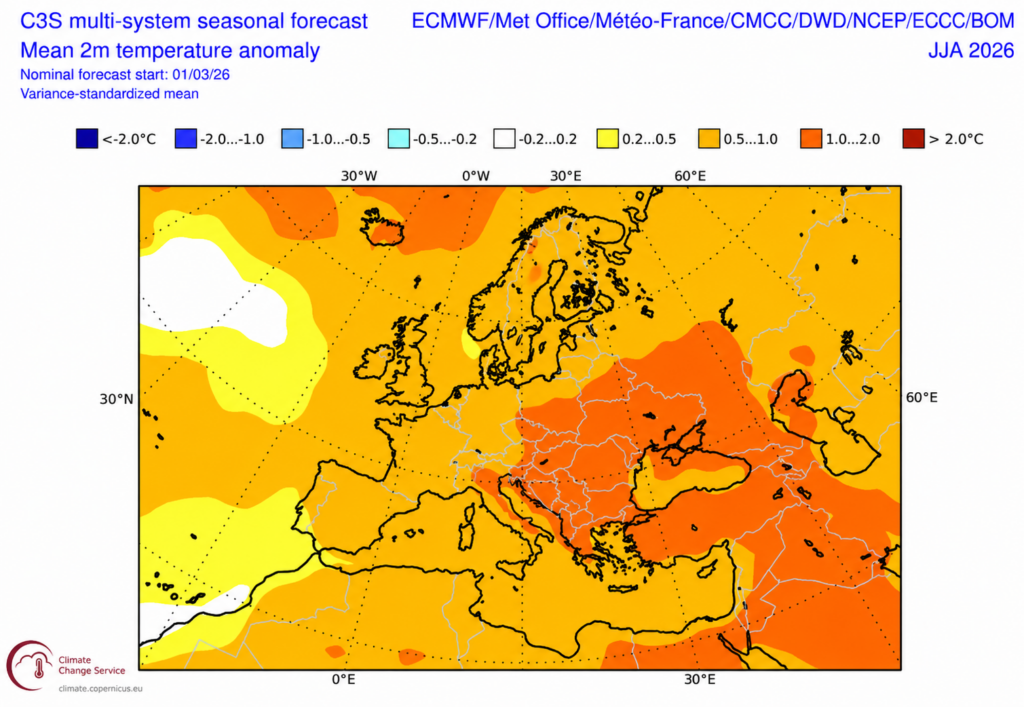
Our modern resilience comes from being able to see El Niño coming well before its worst effects hit. But there are some concerns that countries and aid groups may have a harder time mounting a response to El Niño-linked extreme weather events because of cuts to aid budgets and other political developments. These have especially affected some of the most vulnerable countries in the world, especially East Europe (the Balkans).
The effects of a strong El Niño can include flooding in some areas while drought, heat waves and wildfires plague other regions. Crop losses are common in some countries during an El Niño, as is biodiversity loss, coral bleaching and mortality due to unusually hot temperatures. The advent of accurate El Niño forecasts since the early 1980s is helping society become more prepared for the impacts of each El Niño. Knowing that one is coming can enable forecasters to make accurate projections for seasonal temperature and precipitation, as well as hurricane and typhoon seasons worldwide.
As El Niño forecasts have grown more accurate over time, humanitarian groups, governments, companies and farmers have become more adept at preparing for its effects, though the most vulnerable and underserved communities may not have access to all the information they need. However, there are actionable preparation steps that countries like East Europe can take to lessen the effects of a “Super El Niño.” These include:
Agricultural Safeguards – With rising summer temperatures and altered precipitation in 2026, crop stress is a primary risk. Farmers should drought-proof fields, invest in efficient irrigation, and use seasonal climate trackers like the Copernicus Climate Change Service to plan planting and harvesting schedules.
Flood Mitigation – Because El Niño patterns can increase unsettled, wet weather in the Mediterranean and Southeastern European regions, check drainage systems and reinforce flood defenses ahead of autumn storms.
Energy and Winter Planning – El Niño frequently causes shifts in the polar vortex, which can increase the likelihood of late-winter cold snaps. Municipalities and households should secure energy supplies, insulate properties, and service heating infrastructure early.
Monitor Official Alerts – Track ongoing ENSO developments using official meteorological updates from the World Meteorological Organization. For localized, real-time forecasts specific to your region, consult national weather agencies.
Forecasts indicate the 2026-2027 El Niño will probably be a historically strong “Super El Niño.” For Eastern Europe, the extreme heat could be devastating to human life. The WHO reported that deaths from heat in this region are three times the global average. Further, 85 percent of heat-related deaths in the Balkans occur among people aged 65 and older. Europe is one of the oldest continents demographically. Adding to the human cost, a “Super El Niño” would also increase food insecurity and place severe strain on energy grids. Climate change amplifies El Niño, making associated heat waves, droughts and floods stronger and more frequent. While El Niño remains a natural climate cycle, global warming intensifies its impacts. Continued fossil fuel use remains the largest driver of climate change, and East Europe is among the slowest regions to move away from fossil fuels. If we want to reduce the impacts of future “Super El Niño” events, we must reduce fossil fuel use. When will we ever learn?
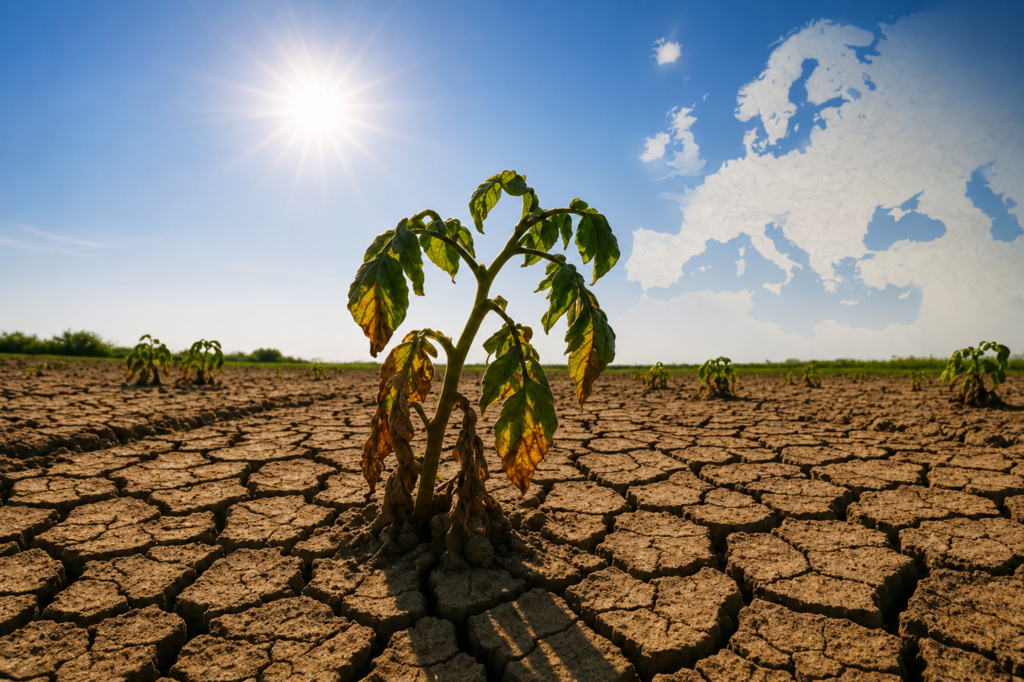
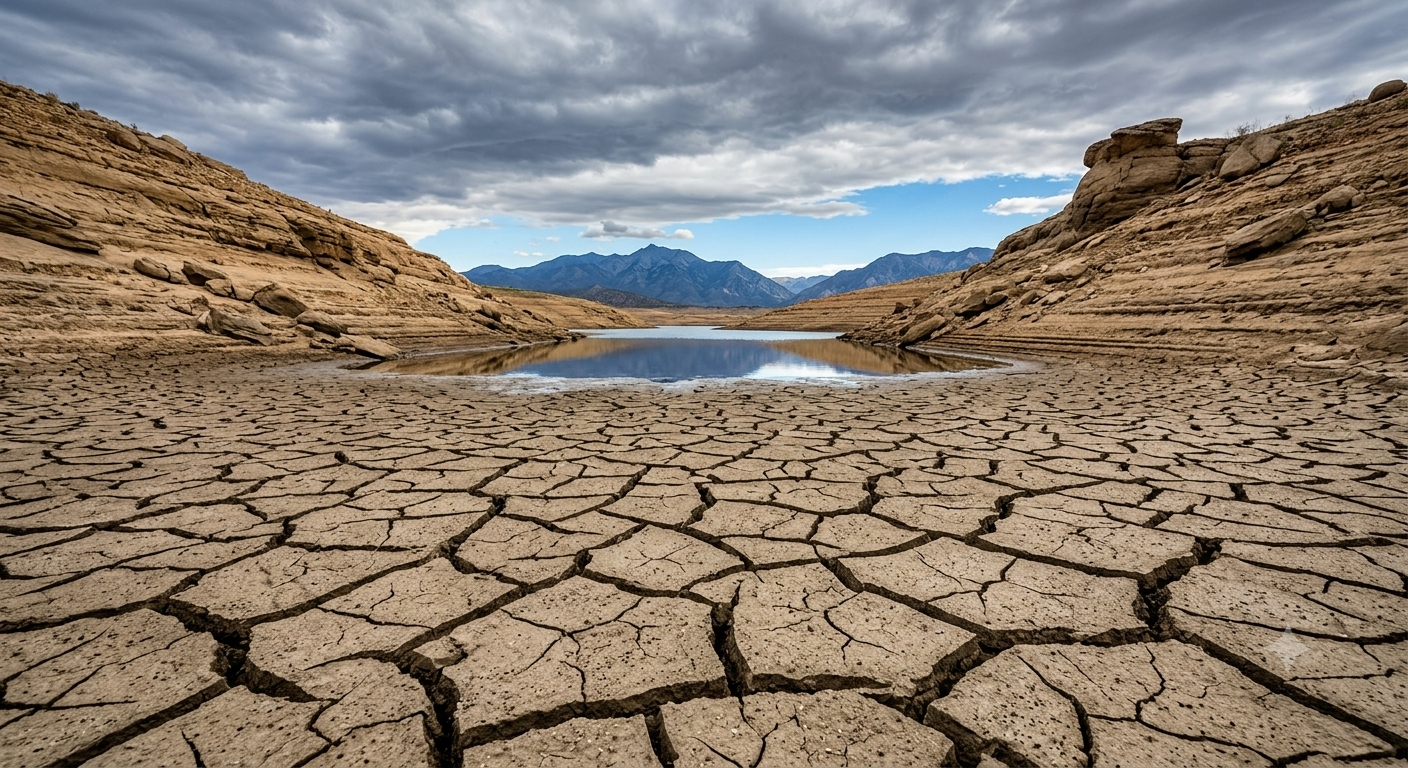
Potential potato field in the Balkans in 2026-27
References
Flis, Andrej. Latest Forecasts Show a Super El Nino Developing. www.severe-weather.org. April 2026.
Journal of Science. www.science.org. 10.1126/scince.adf2983.
L’Heureux, Michelle. What is an El Nino in a Nutshell? NOAA. May 2014.
Wall Street Journal. Global Economy Slowing. May 21, 2026.
Keith-Lucas, Sarah. Is a Super El Nino on Its Way? BBC News. April 10, 2026.